In my many years of experience as a Christian single, I've seen a pretty consistent theorum emerge about the mathematical nature of Christian singleness. While it doesn't necessarily provide any clues to causation, it does serve as some sort of a "proof" to the concept and its corollaries.
There are a few assumptions that this theorum makes. First, one assumes we are dealing with a population of self-professing Christians. Second, we assume that our population of Christians are restricting themselves to marrying other Christians, as many denominations teach and advise, based on their reading of Scripture. Third, we assume that the following concepts work within the context of a Christian university. Expanding this to all levels of higher education will skew the numbers in a way that is unhelpful and rather baffling. Also, it makes me look foolish. So let's dispense with that.
These assumptions being established, we can proceed.
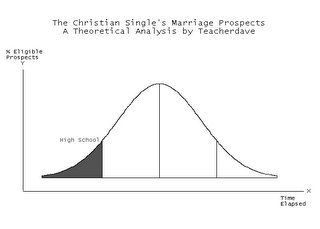
Figure 1 (below) shows the basic structure of this concept, which I have termed "The Bell Curve of Christian Marital Availability."

You will recognize this diagram as a common mathematical bell-curve distribution, divided into four zones.
The first zone is labelled "High School." Please note that as time in high school elapses, the number of potential matches (termed "eligible prospects") increases also (not to mention the feasibility of making such matches).
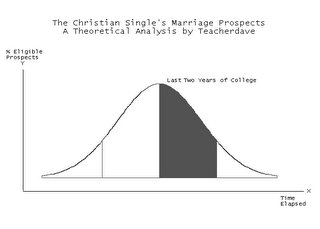
The second sector of this diagram represents the first two years of college at a four-year private religious college or university. There are some factors that affect the population of "eligible prospects" including "MRS Degree" turnover and another phenomenon called "escaping the bubble." (These may be discussed at a later date.) However, in general, the field of candidates grows and starts to peak at the end of the sophomore year.

At this point, the graph takes a turn. Enough time has passed for the MRS anomalies to be worked out, and the population has not only started pairing off, but have indeed begun the steady succession of marriages that fill the summers after the last three years of college.
In Figure 4 (below), we can see the downswing begin. Please remember that the darkened portion represents the percentage of eligible prospects over time. Indeed, by the end of the senior year, if one is not already involved with another prospect or married already, the number of possible matches has dwindled back to practically as few as there were at the beginning of college.
Finally, in the post-college period, that number of eligible singles shrinks even more. Other phenomena, such as "High School Reunion" and "Everyone Else is Having Babies," take their toll on this population, particularly among the females in the group. More marriages, more pairings, and as a result, fewer prosects. 
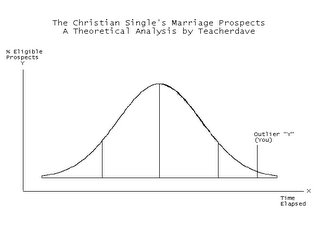
Let's take a look at a particular case study. As is often typical in such settings, in any given sample population, there are one or two "outliers." These are subjects whom the rest of the population are quite confident will be single longer than they are. These subjects represent the furthest standard deviation from the mean, and are used to give a boundary. Sometimes these statements are given as a positive hypothesis ("If I get married before X, I will be okay."), while others are formed as negative hypotheses ("If I don't get married before X, please someone shoot me.").
Let's say you are in this fourth phase, the "post-college" period, and there is another generally recognized subject who is the "outlier." Let's call this outlier "T." You go along, fairly confident that T will never get married, or at least will take longer than you will. This is through no fault of T's of course. It's simply a fact of nature.

Suddenly, however, nature takes an unexpected turn. Through an act of God (or chance, if you prefer), T suddenly gets married, thus removing him from the equation. This may in fact leave you as the sole outlier instead. This realization can cause quite an emotional uproar in certain segments of the population (most often female, though males have been known to be greatly affected by this). That is why it is important to find as secure of an outlier as possible, when forming your understanding of the scenario at hand.
A corollary of this theorum has to do with the percentage of single friends and married friends you have over time. To simplify things, we will look at the second half of the chart: the last two years of college, and then the post-college years.
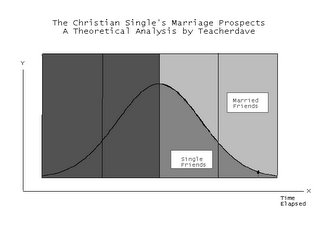
As you can see, as time progresses, the balance shifts from a majority of single friends, to a vast and somewhat overpowering majority of married friends. While these married friends are just as treasured as the single friends were (especially since most belonged to the former group at some point), it still becomes difficult to find other singles to socialize with.
===
I hope that this brief presentation has helped to ease your mind on your single status, or has helped you understand the situation facing your single friends, if you are married. Hopefully, through better understanding of mathematics, we can find a better way to relate to each other in our particular marital contexts.
In the meantime, if anyone knows any intelligent, attractive, Christian single girls in the Houston area, let me know. The sooner, the better.

No comments:
Post a Comment